The Demographics of Household Debt In America
American household debt is on a relentless upward trajectory. It was at a record $18.20 trillion by 2025, up $4.6 trillion since 2019. It includes $12.80 trillion owed on mortgage loans, $1.64 trillion in auto loans, $1.63 trillion on student loans and $1.18 trillion in credit card debt.
Delinquency rates – accounts that are 30 days or more behind on a payment – are also on the rise, with 4.3% of debt in some stage of delinquency.
With 90% of Americans having some form of debt, you likely can see yourself in those statistics. It’s even more likely if you’re between 30 and 59, or female, Black, or have kids.
Household debt demographics may capture who is most likely to get into debt, but they aren’t the full picture. Understanding debt statistics and what’s behind them will help you manage your finances, get out of debt, and build a strong financial foundation for yourself and your family.
Average American Household Debt: Key Statistics
Household debt is divided into categories, with the biggest being mortgages, auto loans, credit cards and student loans. Riding alongside mortgages are home equity lines of credit – a revolving loan that homeowners who have paid down enough of their mortgage can take out. While they’re a fraction compared to the other categories, they’re on the rise. Other household debt includes personal loans, medical debt, and any other credit that a consumer takes on and doesn’t pay off immediately.
The biggest category by far is mortgages, at $12.8 trillion. Mortgages account for 70% of the $18.20 trillion household debt load. A home purchase is likely the largest debt you will take on in your life, and with the median price of a home in America $414,000 in 2025, that’s a big loan even with 20% down. Vehicles and a college education are expensive too, which is why auto ($1.642 trillion), and student loans ($1.631 trillion) are the second-biggest categories, at 9% each. While credit card debt in America is “only” 7% of the overall household debt load, the fact that it’s revolving credit rather than a term loan, usually with much higher interest than the other three categories, means it can be hard to pay down and eventually pay off. While your mortgage and auto loan may be the biggest debt bills of the month, your credit card payment is likely the largest in proportion to what you owe.
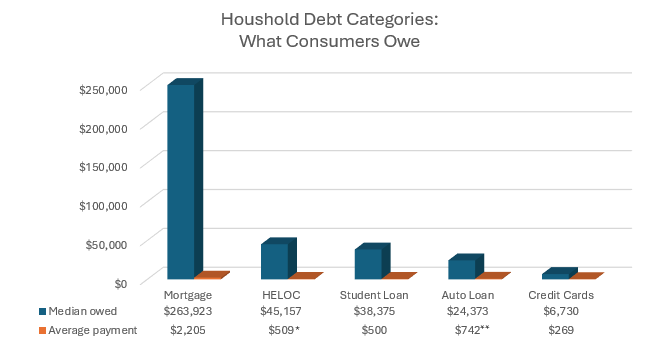
*15-year payoff of average HELOC balance once draw period ends
**New car loan
» Learn More: U.S. Poverty Statistics
Household Debt by Demographic
Age, gender, race, family type and education level all play a part in American household debt statistics. A consumer’s circumstances have a direct impact on how they use credit, what kind of credit they can get, and how able they are to pay it back.
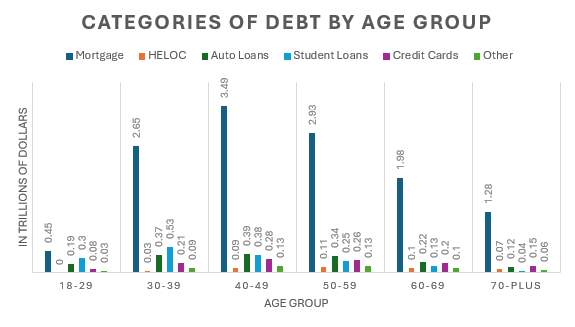
Debt and Age
Anyone who’s old enough to get credit can accumulate debt. The youngest and oldest borrowers have the lowest debt, while borrowers in the three middle age groups, spanning ages 30-59, have much more. It makes sense – these borrowers are more likely to be working full-time while supporting families. If they’ve bought a house, they likely have a big chunk of mortgage to pay off, but they’ve also managed to grow equity and can borrow on the property. A surge in student loan delinquencies tied to the end of the COVID-era five-year pause, reporting delinquent accounts to credit bureaus has started to have an impact, particularly in the 40-49 age group. The older the consumer, the more likely they are to have a credit card – 91% of those 65 and over have at least one. The youngest and oldest consumers are more likely to pay off card balances every month, while more than half of those between 30 and 59 carry a balance.
Total debt (including mortgages) by age group, and average per-capita amount
| AGE GROUP AND POPULATION | TOTAL DEBT | PER-CAPITA AVERAGE |
|---|---|---|
| 18-29, 52.6 million | $1.05 trillion | $19,962 average |
| 30-39, 46 million | $3.89 trillion | $84,565 average |
| 40-49, 41.7 million | $4.76 trillion | $111,148 average |
| 50-59, 41.3 million | $4.02 trillion | $97,336 average |
| 60-69, 40.4 million | $2.73 trillion | $67,574 average |
| 70 and older, 40.1 million | $1.73 trillion | $43,142 average |
Source: Federal Reserve
Percentage of credit-card holders by age group, and percentage of those who carry a balance
| Age Group | % with credit card | % who carry a balance |
|---|---|---|
| Age 18-29 | 65% | 45% |
| Age 30-44 | 80% | 53% |
| Age 45-59 | 86% | 54% |
| Age 60+ | 91% | 39% |
Source: Federal Reserve
Debt and Family Type
Only 64% of parents said they are doing at least OK financially in the Federal Reserve’s most recent annual Economic Well-Being of U.S. Households survey, compared to 72% overall. It’s no surprise that when there are children in a household, debt can add up. The median monthly amount for the 1-in-4 parents who pay for child care is $800, a good chunk of many people’s monthly pay. Add the cost of food, clothing that’s quickly outgrown, transportation, and utilities – all covered by the same income that would cover the parent if they had no kids to take care of.
Couples with children are more likely than those without to have debt across categories, including mortgages, car loans and credit card balances. The highest average amount of credit card debt balances in America is held by couples with kids, followed by single parents.
Percentage of debt by category and family type
| Family structure | % with mortgage debt | % that carry credit card balances | % with car loans | % with student loans |
|---|---|---|---|---|
| Couple with child(ren) | 63.1% | 55.4% | 51.4% | 31.1% |
| Single with child(ren) | 33.5% | 54% | 38.1% | 25.8% |
| Couple with no child | 41.3% | 38.9% | 36% | 16.4% |
| Single, under 55, with no child | 20% | 45% | 22.4% | 34% |
| Single, 55+, with no child | 25.7% | 34.7% | 14.4% | 4.1% |
Source: Federal Reserve
Median balances owed, by category, by those in the family type group who have that type of debt (for instance, single people over 55 without student loans aren’t factored in). Median means that half have a higher balance, half lower.
| Family structure | Mortgage | Credit card | Car loan | Student loans |
|---|---|---|---|---|
| Couple with child(ren) | $194,000 | $3,400 | $18,000 | $28,000 |
| Single with child(ren) | $107,000 | $1,900 | $9,800 | $20,000 |
| Couple with no child | $162,000 | $2,800 | $17,000 | $27,500 |
| Single, under 55, no child | $141,000 | $2,000 | $14,000 | $18,400 |
| Single, over 55, no child | $80,000 | $3,000 | $13,000 | $30,000 |
Source: Federal Reserve
Income and assets by family type. Retirement account balance and home value are averaged for those in family type who have those assets, not an overall average for the family type.
| Family type | Average pre-tax income | % with retirement account | Average retirement account balance | % that own home | Average home value |
|---|---|---|---|---|---|
| Couple with child(ren) | $199,550 | 64.7% | $341,000 | 78.2% | $550,010 |
| Single with child(ren) | $56,440 | 36.7% | $92,140 | 50.5% | $300,110 |
| Couple with no children | $190,490 | 66.6% | $467,180 | 77.3% | $540,180 |
| Single, under 55, no children | $66,264 | 45.4% | $72,580 | 25.3% | $286,400 |
| Single, 55+, no children | $82,030 | 35.9% | $311,500 | 55.5% | $333,020 |
Source: Federal Reserve
» Learn More: Financial Assistance for Single Parents
Debt and Race
Numerous studies have found there are racial disparities in lending, credit reporting and scoring that end up being a catch-22 for Black and Hispanic borrowers. Having a mortgage and credit helps build a credit history that allows more favorable borrowing, but if you can’t get credit, you can’t build the history.
Credit and Race
Black and Hispanic borrowers, on average, have lower credit scores than white consumers, so their choices are limited. A study by the Urban Institute found it’s even worse for Native American borrowers, who are largely credit invisible.
The Federal Reserve found that Black and Hispanic applicants were denied credit, or were approved for less than requested, at higher rates than white borrowers, despite income level. The Fed and the U.S. Government Accountability Office also found that credit and loan interest rates are higher in zip codes that are majority Black or Hispanic.
Even a small difference in interest rates can mean higher monthly payments and the overall cost of credit or a loan. Because of less access to banks and other traditional forms of credit, Black and Hispanic consumers are more likely to use riskier and more expensive methods of borrowing, like high-interest payday loans, pawn shops, auto title loans and “buy now/pay later” offers.
| Race/ethnicity | % with credit card balances | Average credit card balance |
|---|---|---|
| White | 42.2% | $6,930 |
| Black | 56.3% | $4,360 |
| Hispanic | 55.8% | $4,150 |
Source: Federal Reserve
Percentage, by race, of borrowers who use non-banking borrowing because of lack of access to traditional credit and loans
| Race/ethnicity | Payday, auto title, pawn loans | Buy now/pay later |
|---|---|---|
| White & Asian | 3% | 10% |
| Black | 10% | 20% |
| Hispanic | 11% | 21% |
Source: Federal Reserve
Percentage of consumers denied credit, or approved for less than what was requested, by income.
| Race/ethnicity | Less than $5,000 | $50,000-$99,000 | $100,000 or more |
|---|---|---|---|
| White | 47% | 27% | 13% |
| Black | 65% | 41% | 29% |
| Hispanic | 59% | 37% | 24% |
Source: Federal Reserve
Difference in interest rates on borrowing between zip codes with non-white populations compared to largely white neighborhoods, both controlled for credit score and income, and not taking credit score and income into account.
| Majority Hispanic | Majority Black | Mixed with no majority | Mixed with majority white | |
|---|---|---|---|---|
| With credit score, income control | +1.3 | +1.4 | +0.2 | +0.4% |
| Without credit score, income control | +0.6 | +0.5 | +0.4 | +0.2% |
Source: GAO, Federal Reserve
Mortgages and Race
A mortgage is likely the biggest debt a consumer will have, but it comes with financial benefits. As the mortgage is paid down, equity in the home builds, bringing other borrowing opportunities. Owning an asset like a house also builds wealth and is key to generational wealth.
Multiple studies show that it’s more difficult for Black and Hispanic borrowers to get a mortgage, and when they do, they pay a higher interest rate. A National Association of Realtors study on race and homebuying in America found that white buyers are more likely to own a home, can afford a more expensive home, are less likely to be denied credit and are more likely to get a traditional mortgage than one backed by the FHA or VA. FHA loans don’t require as high a down payment as a traditional loan, but often have higher interest. VA loans often don’t require a down payment at all, but that’s up to the lender, as well as what interest to charge. In both cases, borrowers are paying a larger chunk of the home’s cost because of a smaller down payment.
| Race/Ethnicity | % who own a home | Average max. home value renters can afford | Credit denial rates |
|---|---|---|---|
| White | 72.4% | $220,770 | 11% |
| Black | 44.7% | $163,080 | 21% |
| Hispanic | 51% | $214,100 | 17% |
Source: National Association of Realtors, National Community Reinvestment Coalition
| Race/Ethnicity | % with a mortgage | Average mortgage balance | Traditional mortgage | FHA or VA mortgage | Average home value |
|---|---|---|---|---|---|
| White | 43.9% | $214,740 | 71% | 22% | $488,310 |
| Black | 32.8% | $151,090 | 41% | 55% | $307,480 |
| Hispanic | 32.9% | $192,080 | 53% | 39% | $328,000 |
Source: Federal Reserve, National Association of Realtors
Student Loans and Race
Student loan debt also disproportionately affects people of color. An Investopedia analysis determined that among populations, Black, Hispanic, and Native American borrowers generally had higher unmet financial needs, incurred more student loan debt at less favorable rates, and were more likely to struggle financially to stay in school. Because of financial struggles to pay off loans, Black borrowers find themselves owing more than they borrowed 12 years later.
| Race/Ethnicity | Ever enrolled in higher education | % to earn a degree | average student loan balance | Behind on payments In 2024 |
|---|---|---|---|---|
| White | 73% | 41% | $46,140 | 6% |
| Black | 67% | 27% | $53,430 | 23% |
| Hispanic | 58% | 21% | $26,460 | 20% |
| Asian/PI | 90% | 67% | $51,810 | 3% |
Source: Education Data Initiative, Federal Reserve
| % owed 12 years after borrowing | White | Black | Hispanic | Asian/Pacific Islander |
|---|---|---|---|---|
| Women | 72% | 113% | 86% | 47% |
| Men | 56% | 111% | 79% | 45% |
Source: Educationdata.org
Debt and Gender
Women have made huge economic gains over the decades, but most have more debt than men. In 2024, women earned 83.2 cents for every dollar earned by men, according to the U.S. Bureau of Labor Statistics. The median full-time yearly wage for men in 2024 was $66,793, for women it was $55,244. That gap has an impact on women’s debt. While there aren’t huge disparities in how much women owe compared to men, because women make less money, the debt-to-income ratio is higher. Also, in many households, the mortgage or car loan is in the husband’s name – his debt – but the wife’s income contributes to paying the bills. Women are more often responsible for caring for children as a single parent, caring for aging parents, and have less of a financial safety net, making them vulnerable to debt and making it harder to pay off.
The one area where there is a big difference in debt between women and men is student loans. Women account for 63.6% of all student loan debt, initially borrowing an average $43,300, while men borrow $38,300. It also takes women longer to pay off their loans.
The Federal Reserve, which compiles household debt statistics, doesn’t parse them by gender, but several studies have looked at how debt differs for women
| Women | Men | |
|---|---|---|
| Say their debt is unmanageable | 39% white, 51% Black | 33% |
| “Very concerned” about ability to pay off debt | 33% | 18% |
| Household has past-due medical bills | 29% | 22% |
| Aged 18-49 and put off buying a house or having children because of debt | 44% | 34% |
| Not likely to pay all their bills in full, on time | 21% | 16% |
| Carry a credit card balance “most of the time” | 22% | 17% |
| Have used predatory high-interest lending in past year | 4.8% | 4.4% |
Source: Financial Health Network, Center for American Progress
Women tend to owe more on student loans and take longer to pay them off than men do.
| Women | Men | |
|---|---|---|
| Average borrowed | $31,346 | $29,862 |
| Average starting salary | $35,338 | $44,172 |
| Median percentage owed after 12 years | 72% | 56% |
Source: American Association of University Women
Credit Card Debt
Credit card debt is one thing nearly all Americans share, regardless of race, gender, or income level. It’s the most common type of debt in the U.S. By the end of 2024, Americans owed $1.18 trillion on 631.39 million credit card accounts. Credit limits were $5.16 trillion, so cardholders still had a lot of debt available to them.
Credit Card Delinquency
In the first quarter of 2025, 7.04% of accounts transitioned into serious delinquency, for a total of 12.31% overall that are 90 or more days late. Some 8.75% of accounts became 30 days or more delinquent. Delinquency spans all age groups, but the younger the account holder, the more likely they are to be delinquent.
Credit Card Balances by Age
Credit card debt is spread across all generations, with younger consumers having the smallest share of the total. Average credit card debt in America steadily rises until borrowers near retirement age, then it starts going down.
Credit Card total balances by age group, and the percentage of accounts that became seriously delinquent (90 days or more late) in Q1 2025
| Age group | 18-29 | 30-39 | 40-49 | 50-59 | 60-69 | 70+ | Total |
|---|---|---|---|---|---|---|---|
| Owed | $80 billion | $210 billion | $280 billion | $260 billion | $200 billion | $150 billion | $1.18 trillion |
| Seriously delinquent | 10.34% | 8.73% | 7.60% | 6.45% | 5.05% | 5.57% | 7.04% new, 12.31% overall |
Source: Federal Reserve
Credit Card Debt and Income
About 46% of Americans have credit card debt, and while it’s a small amount of overall debt for many households, the fact that it’s revolving and often carries high interest can make it among the most burdensome debt.
Consumers with the highest and lowest incomes – more than $90,000 and less than $20,000 – are less likely to carry credit card balances than those in the middle. The high-income earners who do carry credit card debt carry the highest balances. But it’s all relative. It’s easier for someone who makes more than $90,000 a year to make payments on $11,210 in credit card debt than it is for someone who earns less than $20,000 to make payments on a $3,630 balance.
Percentage of those with a credit card balance, by income group, and average balance
| INCOME | Less than $20K | $20k-$39.9K | $40K-$59.9k | $60K-$79.9K | $80K-$89.9K | $90K+ |
|---|---|---|---|---|---|---|
| Percentage with credit card balance | 33.4% | 46.4% | 56.9% | 54.4% | 44.46% | 25.4% |
| Average balance | $3,630 | $3,840 | $5,950 | $7,440 | $8,900 | $11,210 |
A federal reserve analysis theorized that households with the lowest incomes don’t have enough of a credit history or access to banking to build up high debt, while those with a higher income are more likely to have the money to pay their balances and access more credit, Meanwhile, many middle-earners find it relatively easy to access credit cards, but then may use them for emergency or other expenses, while not having the money to pay the balance off at the end of the month.
Auto Loan Debt
Americans owed $1.642 trillion on 108.1 million vehicle loan accounts in 2025. Younger borrowers owe less but are more likely to enter serious delinquency. As with all credit, the better the credit score, the more likely you’ll get a loan in the amount you want with an affordable interest rate.
Auto loan originations in billions of dollars per credit score in Q1 2025
-
Credit Score <620: $25.7 billion
-
Credit Score 620–659: $14 billion
-
Credit Score 660–719: $32.9 billion
-
Credit Score 720–759: $24.8 billion
-
Credit Score 760+: $68.1 billion
Source: Federal Reserve
Auto loan total balances by age group, and the percentage of accounts that became seriously delinquent (90 days or more late) in Q1 2025
| Age group | 18-29 | 30-39 | 40-49 | 50-59 | 60-69 | 70+ | Total |
|---|---|---|---|---|---|---|---|
| Owed | $19 billion | $37 billion | $39 billion | $34 billion | $22 billion | $12 billion | 1.642 trillion |
| Delinquent | 4.83% | 3.84% | 2.94% | 1.97% | 1.64% | 1.97% | 2.94% |
Source: Federal Reserve
Percentage of age group members with an auto loan, and average amount of loan (as of 2022)
| Age group | 35-under | 35-44 | 45-54 | 55-64 | 65-74 | 75+ |
|---|---|---|---|---|---|---|
| % with auto loan | 39.6% | 43.4% | 45.5% | 34.2% | 24.4% | 14.4% |
| Average amount owed | $18,420 | $20,200 | $23,600 | $22,840 | $23,690 | $17,020 |
Source: Federal Reserve
Medical Debt
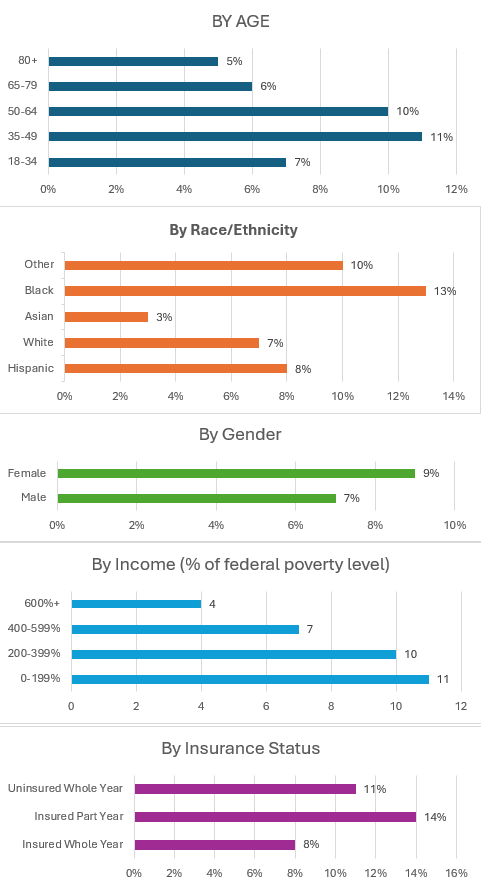
Americans in 2024 owed a whopping $220 billion in medical debt, according to the Consumer Financial Protection Bureau. That’s in line with other studies that found that about 40% of all Americans owe some kind of medical debt when credit cards and loans from family members are included. Of those, about 15% of households in 2022 reported owing more than $250 in unpaid medical bills, with approximately 14 million people (6% of adults) in the U.S. owing more than $1,000 and 3 million people (1% of adults) owing more than $10,000.
While medical debt occurs across demographic groups, people with disabilities or in worse health, with lower incomes and without insurance, tend to be more likely to have medical debt, as are consumers who are middle-aged or Black. Native Americans are disproportionately represented in medical debt in collections, the CFPB found.
Unpaid medical bills that go into collections often appear on the borrower’s credit report, hurting their access to credit, driving up prices of credit they are approved for, and increasing the likelihood of bankruptcy.
The CFPB found that medical debt is a less reliable predictor of credit risk than other forms of debt, because of the nature of how it’s acquired – usually because of an illness or injury that busts a household’s budget. In 2022, the three credit reporting bureaus changed their policies so that medical debt less than a year old (as opposed to 180 days), isn’t reported, giving those who owe time to pay it. The bureaus also agreed not to list medical debt less than $500 on credit reports. Those changes decreased the amount of medical debt on credit reports from 15% to 8%.
One issue with medical debt is that medical bills are often riddled with errors, like double billing and inflated charges, the agency found. More than half of the complaints in 2023 to the CFPB about medical debt in collections – 53% –were that the collections agency was going after debt that wasn’t owed. In a 2024 survey, 25.8% of people with medical debt reported “low or very low levels of financial well-being” related to the debt.
The Peterson-KFF Health Tracker’s most recent numbers on medical debt show 8% of Americans have medical debt of more than $250.
| Debt Amount | Percentage Who Owe | Number of People who Owe |
|---|---|---|
| $251-$500 | 13% | 2.7 million |
| $501-$1,000 | 16% | 3.3 million |
| $1,001-$2,000 | 18% | 3.7 million |
| $2,001-$5,000 | 25% | 5 million |
| $5,001-$10,000 | 13% | 2.7 million |
| $10,001-+ | 14% | 2.9 million |
| All | 100% | 20.4 million |
Source: Peterson-KFF
Native Americans and Medical Debt
The CFPB found that medical debt disproportionally affects Native Americans, even though members of recognized tribes are entitled to free health care through the Indian Health Service, an independent agency of the Department of Health and Human Services. Lack of access drives up medical debt because individuals don’t get regular wellness care that can head off more serious medical conditions and illnesses. The lack of access is made worse by IHS billing and administrative issues that lead to patients being billed for services that were approved as covered, CFPB’s 2024 analysis found. Native medical debt is sent to collections at higher rates than that of other populations. Some 25% of people who live in heavily Native areas only have one account on their credit report – medical debt in collections. That’s compared to 15% of the overall population who have credit reports.
A 2024 study found that Native Americans disproportionately have unpaid medical bills sent to collections when compared to the rest of the population. The study used population tracts as determined by the U.S. Census to identify Native and non-Native areas.
| Native | Comparative rural area | All | |
|---|---|---|---|
| % of population with medical debt in collections on credit report | 8% | 7% | 4% |
| Medical collections is only account on credit report | 25% | 15% | 15% |
| Average medical debt amount owed on credit report | $4,056 | $3,166 | $3,040 |
| Population tracts without access to primary care facility | 11.47% | 7.73% | 4.27% |
| Population age 19-64 without health insurance | 29.4% | 19.7% | 12.6% |
| Population under age 16 without health insurance | 16% | 7.6% | 5.1% |
Source: Consumer Financial Protection Bureau
Student Loan Debt
Paying for college is a long-term burden for millions of Americans. Federal student loan debt accounted for $1.63 trillion of America’s debt load in 2024, and there was an estimated $86 billion more in private loans. That’s more than double what it was a decade earlier. The average balance owed by borrowers on federal student loans is $38,375, and the average balance on private loans is estimated to be around $41,618.
The standard federal student loan payment is based on what’s borrowed and the interest rate, for a 10-year term. Federal Student Aid, the department that administers student loans for the U.S. Department of Education, offers several income-driven repayment plans, but they’re in flux as the department makes changes, and many of those borrowers have been put back into the standard payment pool.
Repaying the average $38,375 loan, with 6.53% interest over the standard 10-year term would mean a $436 a month payment. Over the 10 years, you’d pay a total of $52,359.
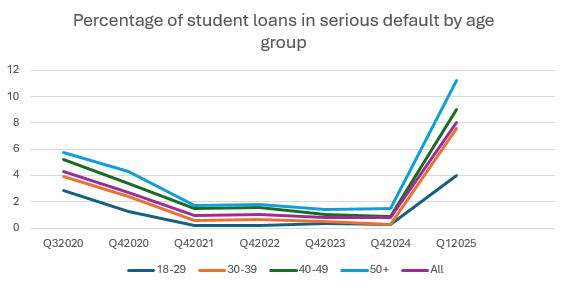
Student loan delinquencies being reported to credit bureaus were paused for nearly five years because of the COVID pandemic. Once they resumed in 2023, there was a one-year grace period of serious delinquencies being reported to credit bureaus. That expired in October 2024 and serious delinquencies – payments 90 days or more late – skyrocketed. In the first quarter of 2025, 8.04% of student loan debt was reported as 90 or more days delinquent, compared to less than 0.80% in the fourth quarter of 2024. The older the borrower, the more likely they are to have a student loan in delinquency. This is at least in part because of accumulating interest that can lead to owing, years later, more than what the student actually borrowed. A pause to income-based student loan programs in 2025 also plunged into debt students who had qualified for lower payments, based on income, who now had to pay the standard monthly payment.
Percentage of federal student loans in serious default by age group, shown at the beginning and ending quarters for each year, as well as 2020Q3, right before COVID pauses in reporting student loan delinquencies to credit bureaus went into effect.
| 18-29 | 30-39 | 40-49 | 50+ | All | |
|---|---|---|---|---|---|
| 2020Q3 | 2.86% | 3.91% | 5.24% | 5.75% | 4.31% |
| 2020Q4 | 1.22% | 2.43% | 3.36% | 4.29% | 2.72% |
| 2021Q1 | 0.18% | 0.57% | 1.31% | 2.24% | 1.00% |
| 2021Q4 | 0.22% | 0.56% | 1.45% | 1.74% | 0.94% |
| 2022Q1 | 0.23% | 0.56% | 1.43% | 1.45% | 0.88% |
| 2022Q4 | 0.18% | 0.66% | 1.55% | 1.79% | 1.02% |
| 2023Q1 | 0.21% | 0.62% | 1.42% | 1.58% | 0.94% |
| 2023Q4 | 0.31% | 0.48% | 1.04% | 1.39% | 0.79% |
| 2024Q1 | 0.30% | 0.41% | 1.02% | 1.39% | 0.77% |
| 2024Q4 | 0.28% | 0.29% | 0.89% | 1.45% | 0.70% |
| 2025Q1 | 3.97% | 7.56% | 9.03% | 11.23% | 8.04% |
Student Loans and Credit Card Debt
Education and credit card debt have several relationships. The more education someone has, the more credit card debt they tend to have – up to a certain point. This is because they often have higher incomes and more access to credit. But higher earnings also mean the ability to pay off balances monthly, so higher earners tend not to carry balances. Fewer consumers with college degrees have credit card debt, but the ones with debt owe more than those with less education.
One of the biggest issues that has emerged with student loans and credit card debt is how student loan delinquency and its impact on the debt-to-income ratio are affecting credit scores. A Federal Reserve analysis in 2025 determined that the impact of the new delinquencies had a staggering effect on credit scores by those who had credit scores of 620 or higher before the delinquency was reported. Some 1.2 million of them had a credit score drop of 100 or more and 1 million had a credit score decline of 150 or more. Those with a credit score of 720 or higher took the biggest hit, with an average decline of 177 points.
“Many would have qualified for new auto, mortgage, and credit cards before these delinquencies were reported,” the analysis said. “These borrowers…will now face steeper borrowing costs or denial for new credit.”
| No high school diploma | High school diploma | Some college | College degree (includes graduate degrees) |
|
|---|---|---|---|---|
| Median annual earnings (age 22-35) | $35,500 | $41,800 | $45,200 | $49,600 (associate) $66,600 (bachelor’s) $80,200 (master’s or higher) |
| % with a credit card balance | 34.1% | 48.3% | 50.8% | 42.2% |
| Median credit card balance | $1,300 | $2,000 | $3,000 | $3,270 |
| Average credit card balance | $4,390 | $4,760 | $6,230 | $7,270 |
| % with student loan balance | 4.4% | 11.3% | 23.6% | 30.6% |
| Median student loan balance | $8,000 | $20,000 | $16,000 | $32,000 |
| Average student loan balance | $12,250 | $34,390 | $31,970 | $58,650 |
Source: Federal Reserve
When the pause on reporting delinquent student loans to credit reporting bureaus ended in 2024, many borrowers saw their credit scores plunge.
| Credit score group prior to student loan delinquency | Count | Share of newly delinquent | Credit score change |
|---|---|---|---|
| Less than 620 | 3.2 million | 56.6% | -74 |
| 620-719 | 2 million | 35.9% | -140 |
| 720+ | 0.4 million | 7.5% | -77 |
Source: Federal Reserve
The Pandemic Impact on Debt
When money’s tight, it’s easier it is to pile up debt, as long as you have access to credit sources. That obvious lesson hit home in 2020, when the unemployment rate went from 3.5% pre-COVID to a peak of 14.8% in April 2020 — the highest level since 1948. The total U.S. consumer debt balance grew $800 billion, an increase of 6% over 2019 and the highest annual growth jump in more than a decade. Student loan debt, mortgage debt and personal loan debt all went up. Credit card debt, however, dropped $73 billion, a 9% decrease from 2019 and the first annual drop in eight years. Federal aid programs, mortgage forbearance, emergency rent programs and student loan forbearance all helped ease the building debt load.
In 2025, five years after the pandemic began and with the pandemic-era aid programs long in the rear-view mirror, the dust had settled. Credit card debt, in particular, rebounded in a big way. It began to climb again in 2023 and by the first quarter of 2025, it was $1.18 trillion, well above the $890 billion it was in the first quarter of 2020, the last pre-pandemic quarter.
Student loan debt climbed as well, and the nearly five-year pause on reporting delinquent accounts to credit bureaus was also having an impact.
Debt accumulation slowed during the early years of the pandemic, but then began building again, and by 2025 had surpassed pre-pandemic levels in all categories, with credit card debt being one of the steepest climbers.
| First quarter by year | All debt (in trillions) |
Mortgage | Revolving home equity | Auto loan | Credit card | Student loan | Other |
|---|---|---|---|---|---|---|---|
| 2020 | 14.30 | 9.71 | 0.39 | 1.35 | 0.89 | 1.54 | 0.43 |
| 2021 | 14.66 | 10.16 | 0.335 | 1.382 | 0.770 | 1.584 | 0.413 |
| 2022 | 15.842 | 11.18 | 0.317 | 1.469 | 0.841 | 1.590 | 0.445 |
| 2023 | 17.047 | 12.04 | 0.339 | 1.562 | 0.986 | 1.604 | 0.512 |
| 2024 | 17.687 | 12.44 | 0.376 | 1.616 | 1.115 | 1.595 | 0.543 |
| 2025 | 18.203 | 12.80 | 0.402 | 1.642 | 1.182 | 1.631 | 0.542 |
Source: Federal Reserve
What Should You Do If You’re in Debt?
If you have debt, it’s real, not just a number in the sea of American debt statistics. It has an impact on your life. There are things you can do to eliminate debt and be part of a different, much more satisfying, consumer debt statistic pool.
Some steps you can do immediately and on your own. Others you may need help to achieve. But no situation is impossible, and you have the power to manage and reduce, or eliminate, your debt.
In general, the best remedy is to create a budget to determine how much money you have coming in and where it’s going. Try to cut expenses and talk to lenders of problem accounts about options for modifying payment plans, lowering interest and fees, or other options to reduce monthly payments. It will benefit you to talk to a credit counselor, who can review your finances with you, help you with the budgeting and discuss debt management and relief plans and options. To learn more about managing or eliminating debt, read debt.org’s advice on the topic.


Sources:
- NA (2025, May 13) Quarterly Report on Household Debt and Credit. Retrieved from https://www.newyorkfed.org/medialibrary/interactives/householdcredit/data/pdf/HHDC_2025Q1
- NA (2025, May 20) Existing-Home Sales Edged Lower by 0.5% in April. Retrieved from https://www.nar.realtor/newsroom/existing-home-sales-edged-lower-by-0-5-in-april
- Hanson, M. (2025, March 16). Student Loan Debt Statistics. Retrieved from https://educationdata.org/student-loan-debt-statistics
- NA (2025, February 13) Household Debt Balances Continue Steady Increase; Delinquency Transition Rates Remain Elevated for Auto and Credit Cards. Retrieved from https://www.newyorkfed.org/newsevents/news/research/2025/20250213
- Horymski, C. (2025, March 27) HELOC Balances Surpass $45,000 in 2024. Retrieved from https://www.experian.com/blogs/ask-experian/research/home-equity-line-of-credit-study/
- NA (2024, December 17) Net Worth, Assets, Debt of Households: 2017-2022. Retrieved from https://www.census.gov/library/visualizations/interactive/assets-and-debts.html
- Haughwout, A. et al (2025, May 13) Student Loan Delinquencies Are Back, and Credit Scores Take a Tumble. Retrieved from https://libertystreeteconomics.newyorkfed.org/2025/05/student-loan-delinquencies-are-back-and-credit-scores-take-a-tumble/
- NA, (2025, April 9) National Population by Characteristics, 2020-2024. Retrieved from https://www.census.gov/data/tables/time-series/demo/popest/2020s-national-detail.html
- NA (2924, May) Survey of Household Economics and Decisionmaking. Retrieved from https://www.federalreserve.gov/publications/files/2023-report-economic-well-being-us-households-202405.pdf
- Stolba, S.L. (2019, May 9) How Does Having Kids Affect Your Debt and Credit? Retrieved from https://www.experian.com/blogs/ask-experian/research/how-does-having-kids-affect-your-debt-and-credit/
- NA (2023, October 31) American Credit Card Debt Hits a New Record-What’s Changed Post-Pandemic? Retrieved from https://www.gao.gov/blog/american-credit-card-debt-hits-new-record-whats-changed-post-pandemic
- N.A. (2023, October 18) Survey of Consumer Finances. Retrieved from https://www.federalreserve.gov/econres/scfindex.htm
- NA (2025, March 19) 2025 Snapshot of Homebuying and Race in America. Retrieved from https://www.nar.realtor/sites/default/files/2025-03/2025-snapshot-of-race-and-home-buying-in-america-03-17-2025.pdf
- Hanson, M. (2025, February 18) Student Loan Debt by Race. Retrieved from https://educationdata.org/student-loan-debt-by-race
- NA (2025, March) Earnings and earning rations by sex, race, and occupation group. Retrieved from https://www.dol.gov/agencies/wb/data/earnings/wage-gap-race-occupation
- Greene, M. et al (2022, July 14) The Gender Gap in Financial Health. Retrieved from https://finhealthnetwork.org/research/gender-gap-in-financial-health/
- NA (2024, March 14) Closing the Gender Pay Gap. Retrieved from
- McGurran, Brianna. (2020, February 28) How History Shaped Today’s Credit Landscape. Retrieved from https://www.experian.com/blogs/ask-experian/women-and-credit/
- NA (ND) Deeper in Debt: 2021 Update. Retrieved from https://www.aauw.org/app/uploads/2021/05/Deeper_In_Debt_2021.pdf
- NA (2024, October 1) CFPB Takes Aim at Double Billing and Inflated Charges in Medical Debt Collection. Retrieved from https://www.consumerfinance.gov/about-us/newsroom/cfpb-takes-aim-at-double-billing-and-inflated-charges-in-medical-debt-collection/
- NA ( 2025, May 7) CFPB, industry groups ask Federal Judge to kill bureau medical debt rule. Retrieved from https://www.consumerfinancemonitor.com/2025/05/07/cfpb-industry-groups-ask-federal-judge-to-kill-bureau-medical-debt-rule/
- NA (2024, September 5) Fair Debt Collection Practices Act CFPB Annual Report 2024. Retrieved from https://files.consumerfinance.gov/f/documents/cfpb_fdcpa-2024-annual-report_2024-09.pdf
- Rakshit, S. et al (2024, February 12) The burden of medical debt in the United States. Retrieved from https://www.healthsystemtracker.org/brief/the-burden-of-medical-debt-in-the-united-states/
- NA (2024, December 12) Medical collections on credit reports in Native American communities. Retrieved from https://files.consumerfinance.gov/f/documents/cfpb_aian-medical-debt_2024-12.pdf
- F, Richard et al (2024, September 18) 5 Facts About Student Loans. Retrieved from https://www.pewresearch.org/short-reads/2024/09/18/facts-about-student-loans/
- NA (2024, May) Annual earnings by educational attainment. Retrieved from https://nces.ed.gov/programs/coe/indicator/cba/annual-earnings
- Chiang, Y. (2024, May 20) Which U.S. Households Have Credit Card Debt? Retrieved from https://www.stlouisfed.org/on-the-economy/2024/may/which-us-households-have-credit-card-debt